
Geoanalytics is just one of the many terms used to describe location-based data analysis. Other names for it include location intelligence, geolocation, geospatial analysis, geographic analysis, and many others.
In reality, all of these terms are describing the same basic idea: applying geography to your business processes in order to gain analytical insights. Geoanalytics is a form of data visualization that contextualizes your data and uncovers insights through geographic location.
Integrating geography with business analytics results in Geoanalytics. Put simply, Geoanalytics gives you a new perspective – a visual perspective.
After all, decision makers don’t need more data, just a better way to interpret what they already have.
This is the problem Geoanalytics is made to solve.
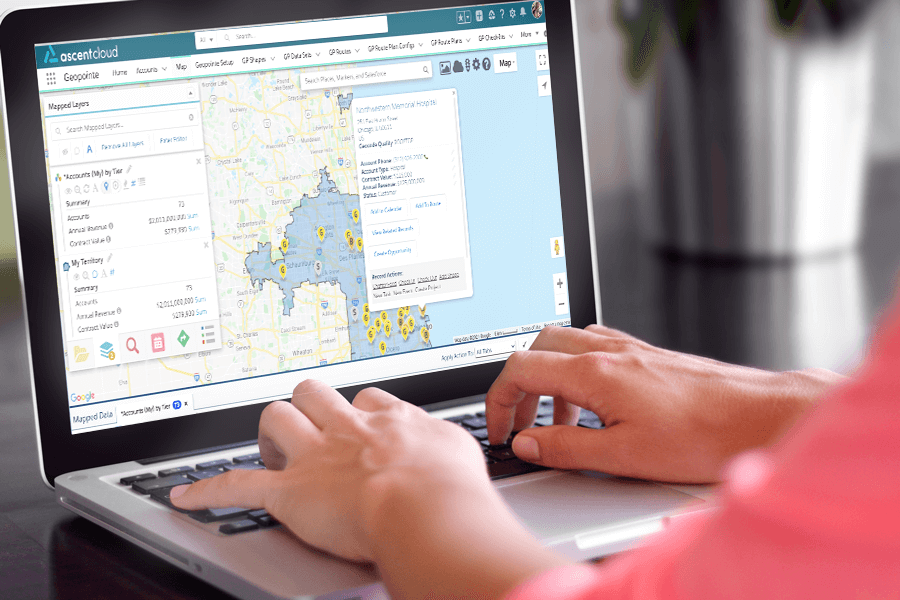
Geoanalytics location-enables your CRM to help you geographically visualize your accounts, contacts, opportunities, and any other CRM data – but how?
It begins by layering sets of data on a map so you can compare and contrast based on geographic boundaries. With Geoanalytics, you can locate and map data anywhere in the world. This visual representation of data makes it easier for the brain to digest and interpret the information.
When your records are displayed on a map like this, it shows you the big picture. Patterns and trends become more clear, particularly when you use some of the advanced filtering and visualization techniques that accompany Geoanalytics.
The map adds an extra dimension that list views and reports are lacking: a geographic understanding of where your records are and how they relate to each other in proximity.
Further, there are many components or capabilities that make up Geoanalytics, and their purposes vary from analysis to management and visualization. Let’s look at each one.
Data sets are the building blocks of most Geoanalytics solutions.
The data sets that you can project on a map with Geoanalytics vary. You can use demographic layers to uncover deeper insight into your customers and accounts, or import any data as long as it has location information like an address or longitude and latitude using CSV layers to analyze whatever you want.
As you now know, Geoanalytics is a powerful form of data visualization that combines geographic location with traditional data analysis. This extra dimension allows for comparisons and instant understanding of complex relationships in your CRM records.
The ability to interact with a map, performing actions like exporting, adding to a campaign and creating leads, is built-in with Geoanalytics. There is so much more to it than just looking at a map – you can work with your CRM data as it’s displayed visually and use the geographic insights it reveals to make adjustments and changes.
Perhaps the most powerful of all the capabilities Geoanalytics brings is the advanced visualization and filtering capabilities you can use to identify trends and patterns. Multiple search types and filtering options make your results tell a story instantly.
Searches can be performed near a particular location, within the boundaries of a territory, or over a broader area. These location lookups could be anything from a view of all accounts clustered by concentrations, to a small neighborhood search for local leads and prospects.
One way to think of Geoanalytics’ advanced analysis and search capabilities is to imagine the filtering capabilities you have in a list view combined with the complex possibilities of a report.
Marker clustering and heat mapping are some of the most powerful representations of data that Geoanalytics provides.
You can view heat maps based on record count or any sort of numeric record field such as opportunity size, annual revenue, or employee count. The data will be displayed across the map with color-coded areas that show concentrations of records in that area.
Alternatively, marker clustering shows you how many records exist in a particular area.
These visual representations reveal insight about gaps, trends or ideal target locations to inform your business strategy.
Thematic mapping allows you to roll-up a metric, such as record count or dollar amount, for any data set you put on the map and group those results by geographic boundaries you determine.
They help to condense large amounts of data for quick understanding of how many records exist within that area. Further, perform calculations of Sum, Average, Minimum and Maximum for the records.
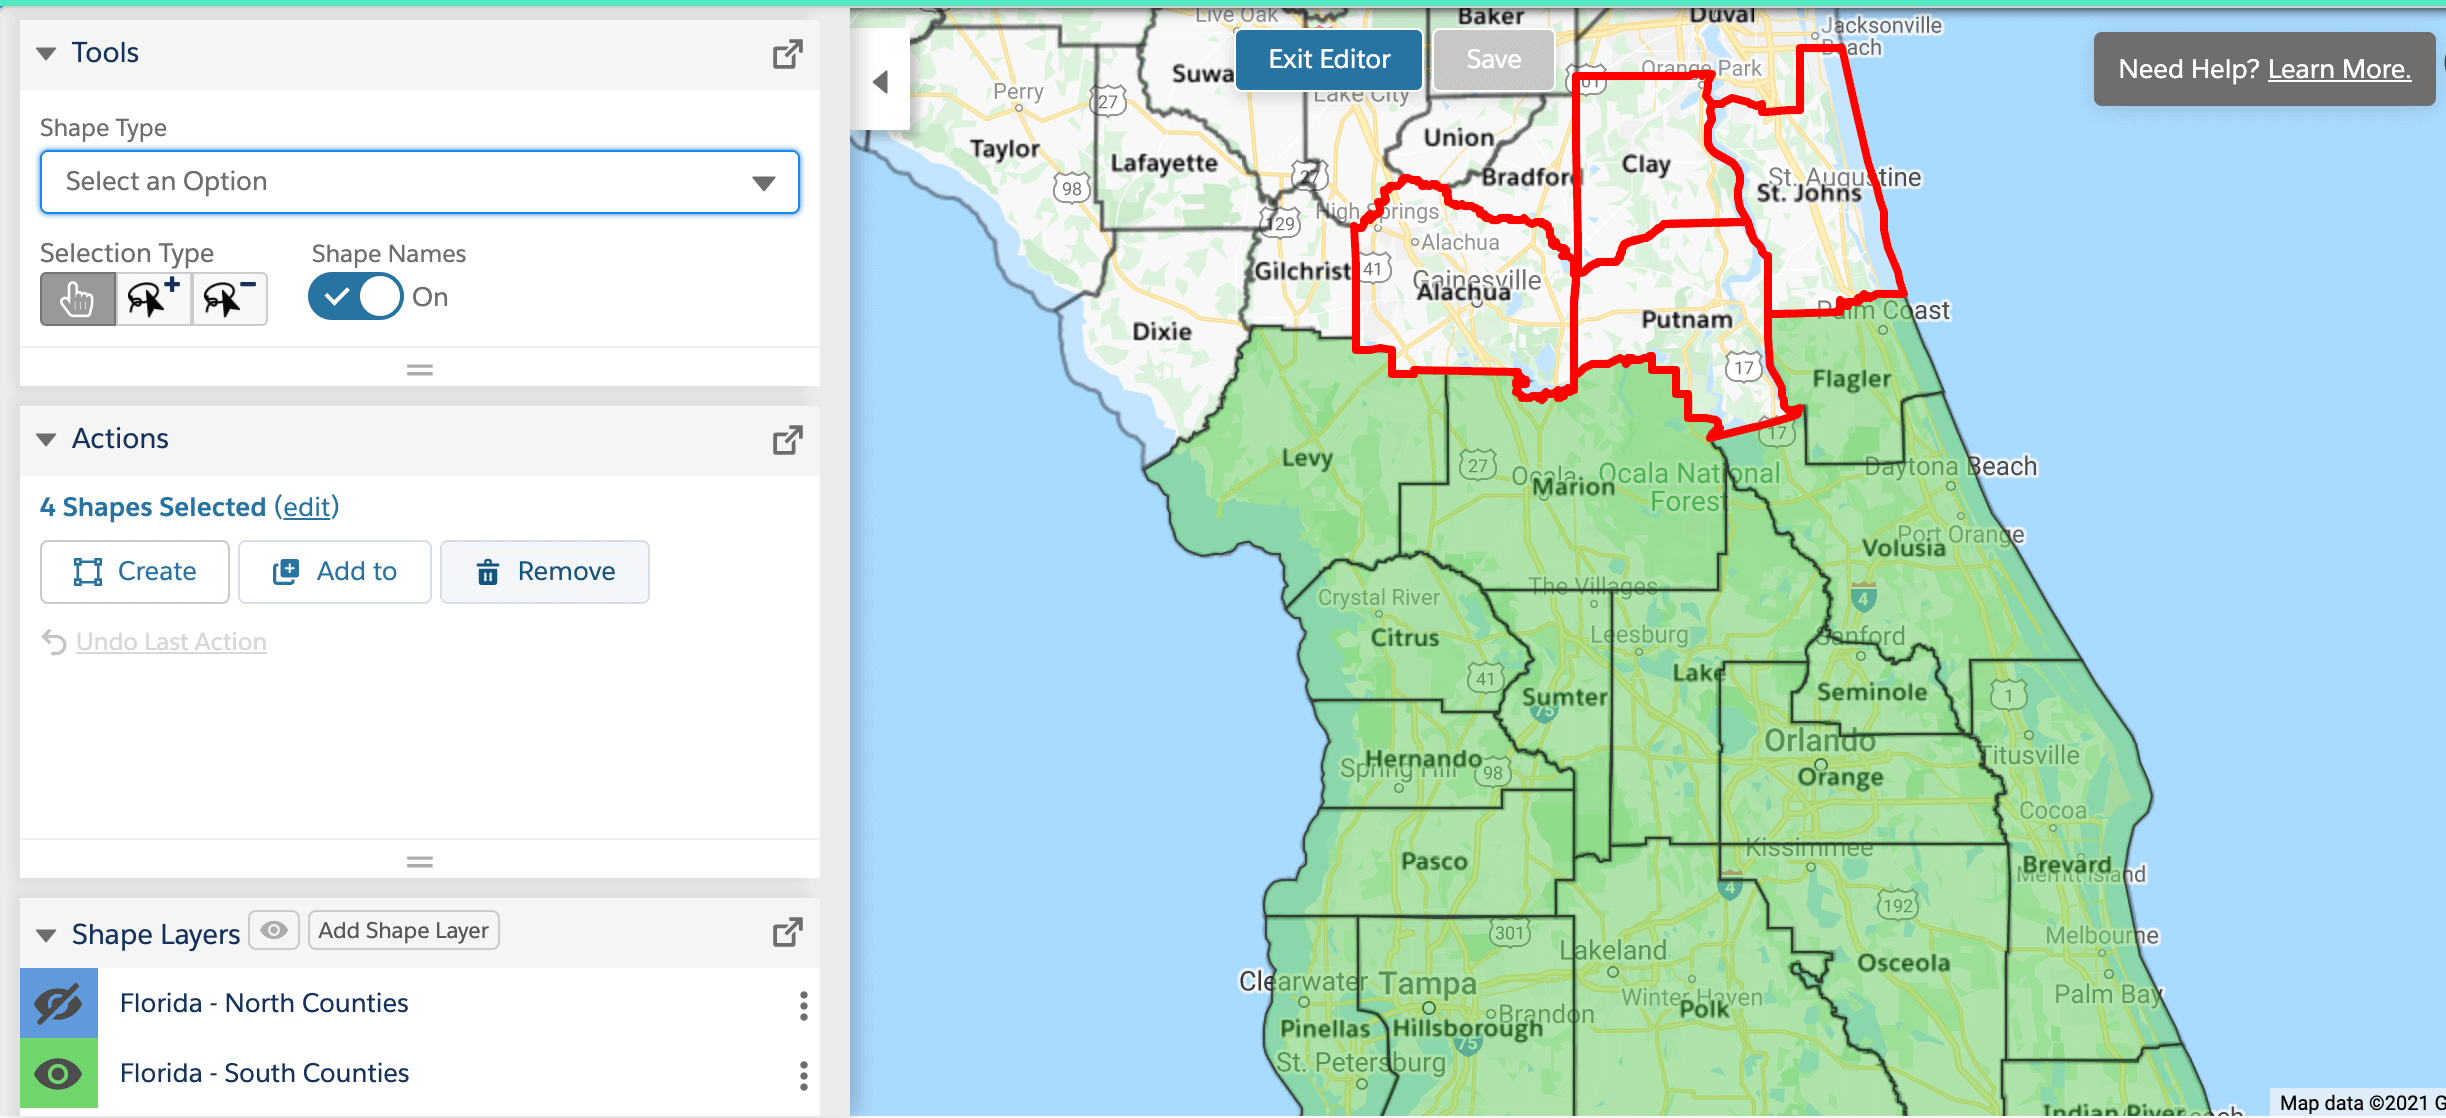
Geoanalytics is often used for territory design and management. The visual representation of data makes it much faster & easier to make adjustments and manage territories.
Instead of using spreadsheets and reports to understand something as visual as sales territories, you can throw up records on a map to analyze the different areas your sales reps own.
Make adjustments from the map (one of the use cases for that interactive mapping component) to ensure territories are balanced, or reassign accounts to a new territory as your sales team and business expands.
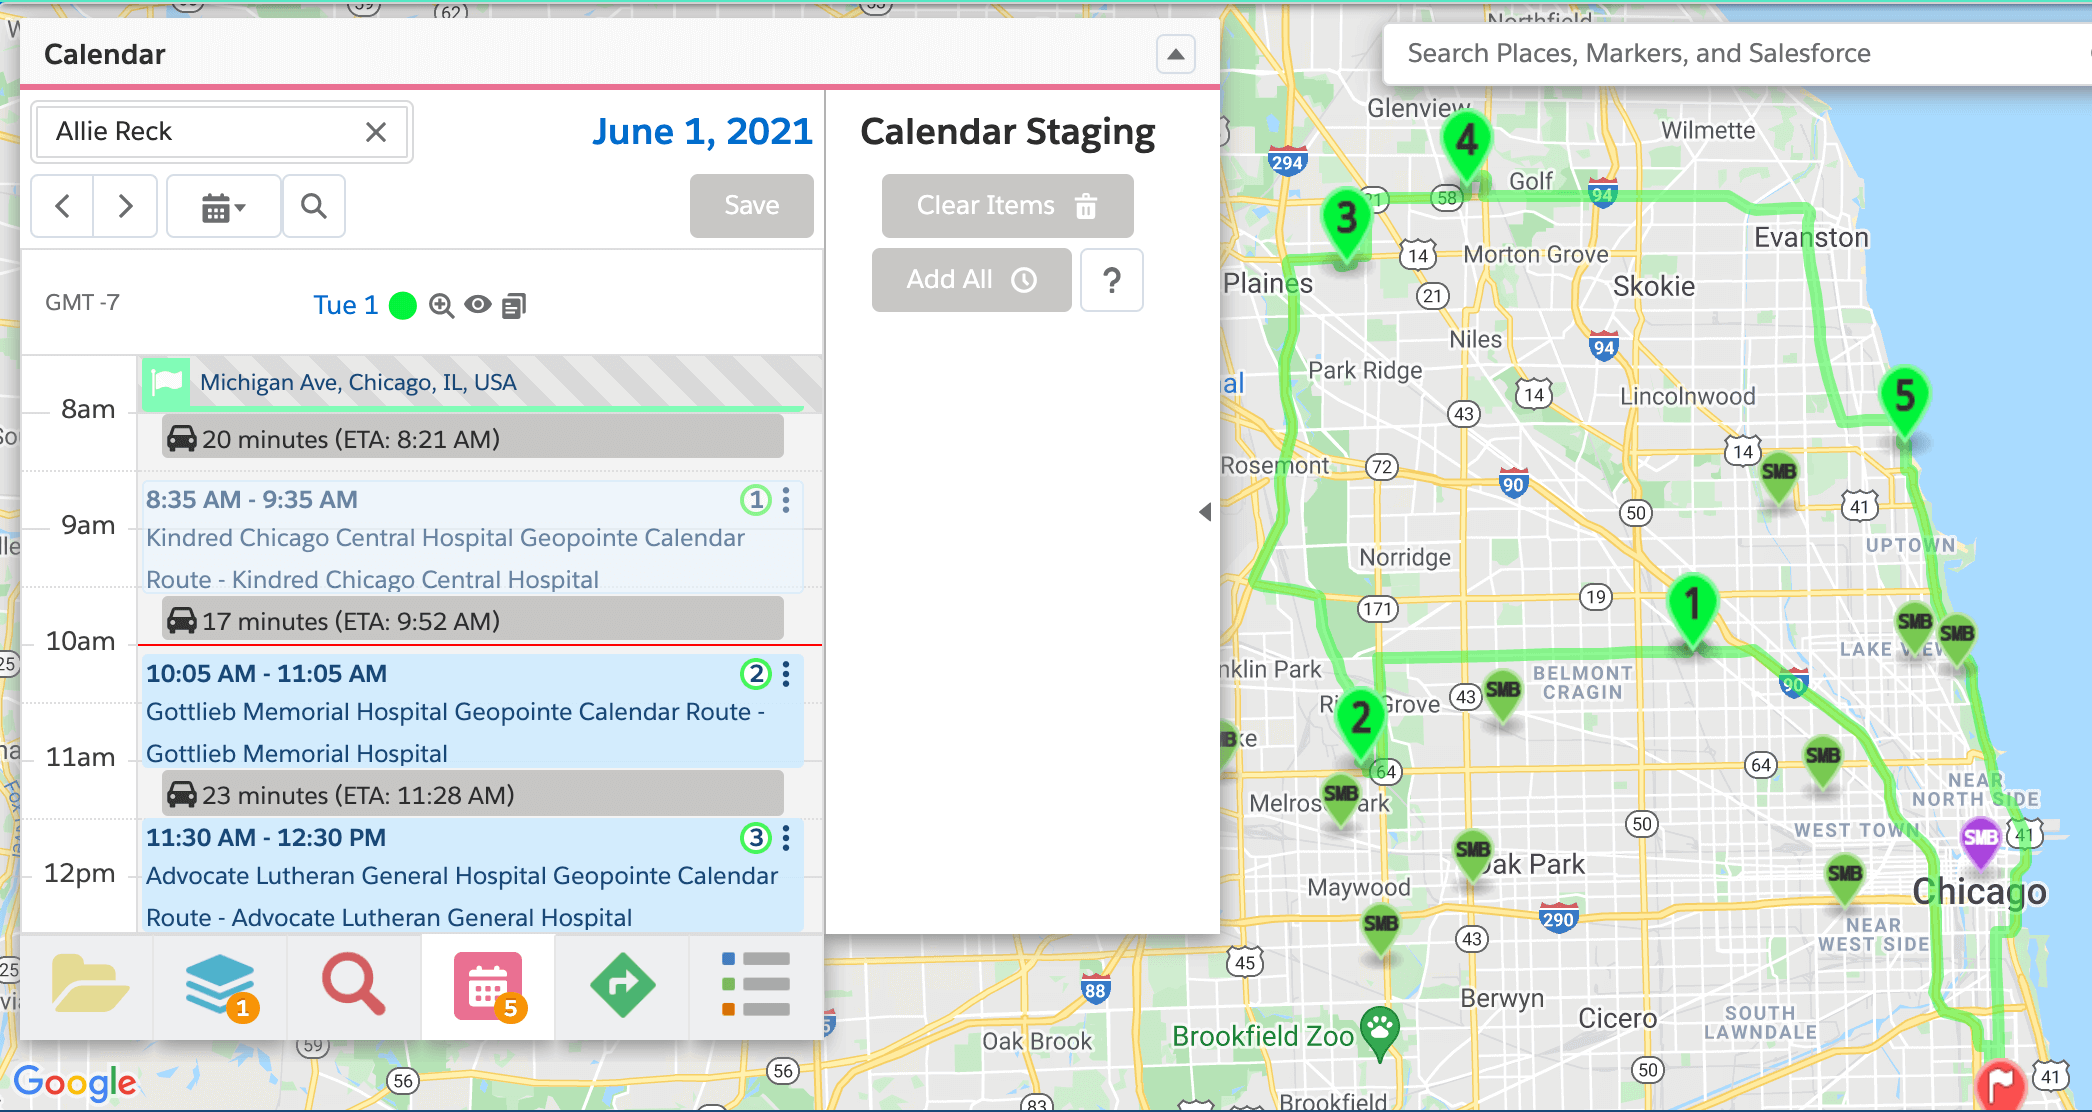
One of the most obvious and self-explanatory components of Geoanalytics is routing and route optimization. With Geoanalytics’ mapping capabilities, you can optimize your travel plans based on the accounts or customers you plan to visit.
Build a route with the accounts you prioritize using heat mapping and clustering, and save that route to access when you’re on the road. Plus, most Geoanalytics solutions will optimize your route to make it more efficient.
Manage your route plan by adding new visits or changing the order if you need to visit some clients at a specific time of day. Geoanalytics helps save you time & money by uncovering the most efficient route possible, but also allows for maximum flexibility in your scheduling.
Complementing the route planning component, some Geoanalytics solutions integrate with your calendar to allow for scheduling and viewing your schedule on a map. You can visualize scheduled travel plans for the future, and the interactive map enables you to update appointments on the fly.
While this isn’t an exhaustive list of the components and capabilities attributable to Geoanalytics, it gives you an idea of the powerful solution Geoanalytics can be. These different components fall into three broad categories that, together, make up Geoanalytics. A quick summary of the many elements of Geoanalytics:
Ok, now you understand what Geoanalytics is – but you’re probably wondering, “Why is Geoanalytics important?” Let us explain.
Geoanalytics is important because of the new perspective it brings to your data. Particularly when it comes to CRM data, reports and dashboards just aren’t enough to truly surface the actionable insights you need. Geoanalytics takes the data you have in your CRM and displays it on a map, making it easier to understand and gain actionable insights that will help you make better decisions.
Geoanalytics also saves you time. Time is the most valuable resource, so wasting it trying to interpret data in spreadsheets and tables isn’t ideal. That’s where Geoanalytics comes in – the visualization it provides sparks instant comprehension.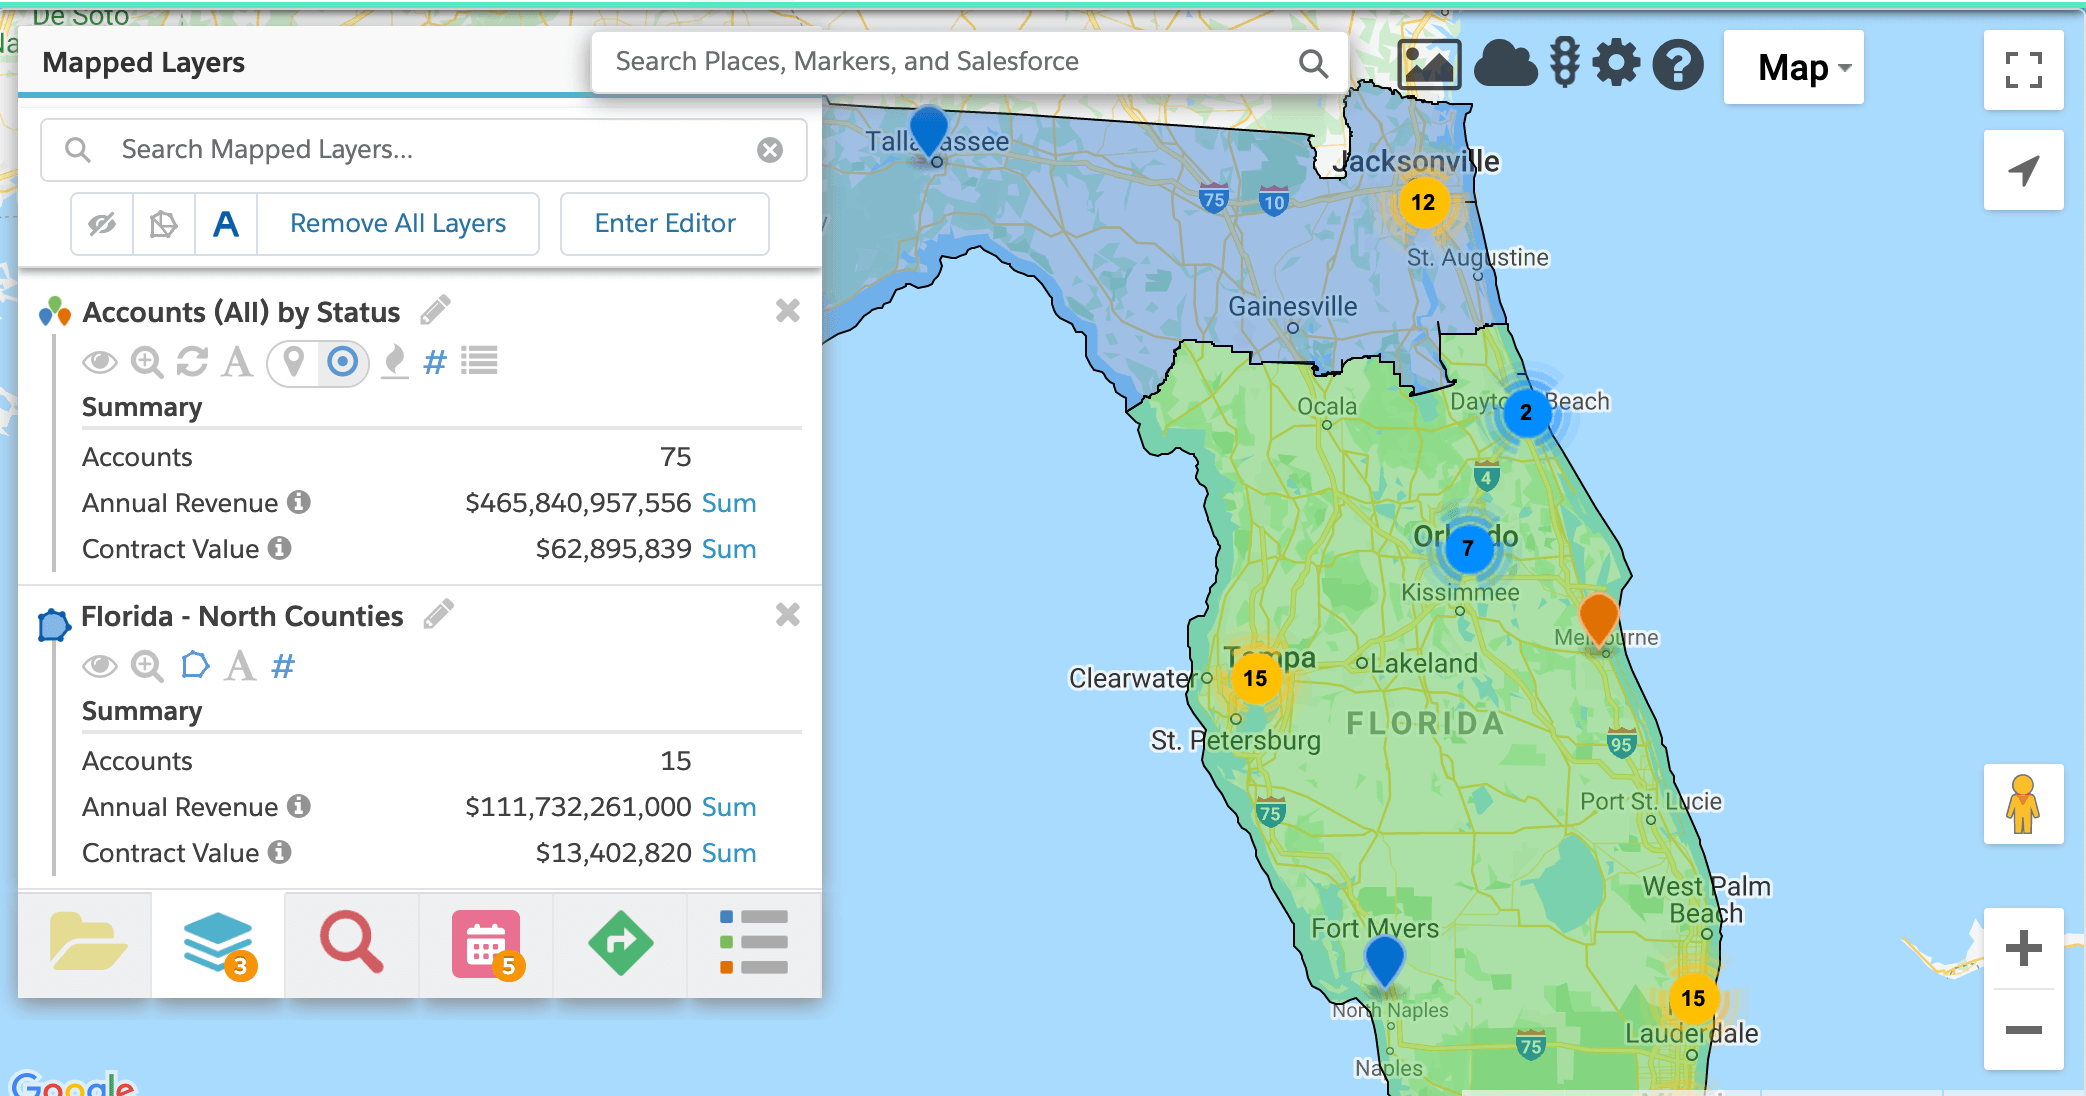
Sure, you could use spreadsheets filled with thousands of data points and eventually come up with some insights. But with Geoanalytics, you can look at a map and instantly see the patterns and understand what the data is telling you.
Because Geoanalytics helps you stay organized tactically, you’ll be able to quickly increase your efficiency and streamline your processes. Further, with the insights gained from Geoanalytics you’ll be able to make better decisions when it comes to your business.
The beauty of Geoanalytics is it can be used in a variety of industries and by a variety of roles.
While we won’t go into the specifics of industry use cases (you can find those in the linked articles below), some of the main industries that use Geoanalytics include:
Geoanalytics allows financial service organizations to visualize concentrations of policies, optimize scheduling and routes to client meetings, and easily track AUM. Companies can provide the best customer experience possible with the added benefits that location insights bring to your CRM.
Geoanalytics helps the healthcare industry improve everything from patient care to operational workflows. Healthcare organizations can optimize product distribution and make medical device sales routes more efficient to reduce cost and deliver the best solutions possible.
Manufacturing supply chain processes benefit from Geoanalytics by improving workflows with geolocation-based insights and performance tracking. It gives companies the ability to visualize their CRM data by showing customers, suppliers, orders, and deliveries on the map.
Optimizing door-to-door sales and service routes is easy for Telecommunications companies that use Geoanalytics. Organizations are able to be more efficient, reducing cost and delivering the best service possible.
As for the job roles that primarily use Geoanalytics, there are a few primary roles that are most likely to use (and benefit from) the various capabilities. They include:
This ability to visualize data and understand its relation to any other given location in the world is incredibly useful and compelling.
With standard data analysis tools, CRM data is often broken down into graphs, charts, lists, and other tabular formats that attempt to provide clear insights. However, these other tools are missing the “where” in your data that connects it with a physical location.
Geoanalytics provides a new context and perspective to data that is simply not possible with reports and spreadsheets. Maps and spatial data can immediately help users discover new insights and communicate more effectively with co-workers and customers.
")

