Got post-pandemic problems? We can help
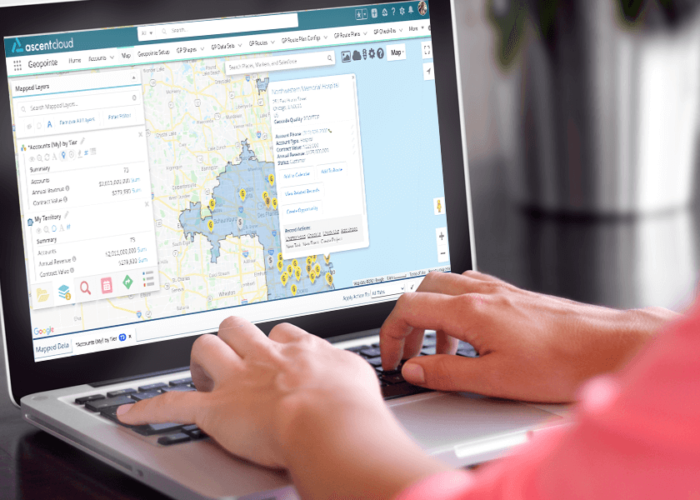
Recently, an article on LinkedIn described the post-pandemic problems B2B companies were facing. Many of the challenges described in the article are ascribed to data insecurity: either inaccurate or nonexistent data, or too much data and too little time to analyze. This inspired us to write a post that lays out how a solution like Geopointe overcomes these significant challenges and makes the life of a sales leader or Sales Operations Manager (and other roles) so much easier.
According to the article, territory management is one of the biggest headaches for Sales Operations post-pandemic. There were issues with things such as balancing & keeping territories equitable, building new territories, and consolidating territories. Additionally, data accuracy and sourcing and a fear of focusing efforts in the wrong direction plagued sales leaders.
If you’re facing similar challenges after the upset of 2020, read on to learn how Geopointe can solve some of your biggest problems.
Ensuring equitable territories for your sales team
One statement in particular stood out to us – in fact, it described the exact problem we had in mind when we built our most popular Geopointe feature, Shape Editor.
Quoting a conversation with LinkedIn’s Senior Director of Global Sales Strategy & Operations, the article references new territory rollout being an example in which data accuracy and reliability is crucial. However, their challenge was that “after rollout, there would always be at least one person with demonstrably less potential in their territory.”
How Geopointe solves this problem: Among the customers we have that use our solution for their territory planning & mapping, the Shape Editor feature is one of the most important features of Geopointe.
We’ve heard from our own customers that post-2020, many organizations are implementing formal territory planning and focusing on analytics-based changes to design. Many report implementing formal account rules and planning as well. With this new focus on data-backed strategy, Geopointe’s Shape Editor significantly decreases time spent trying to adjust territory lines to ensure sales reps have equitable territories.
Shape Editor takes any guesswork in territory mapping out of the equation, solving the problem of inequitable territories that have to be adjusted after the fact. Instead, see how any territory adjustments & new territory rollouts will impact the potential for revenue, number of accounts and opportunities, or other metrics in real-time. Easily readjust territories with our Shape Editor and see the effect those changes will have before you finalize them.
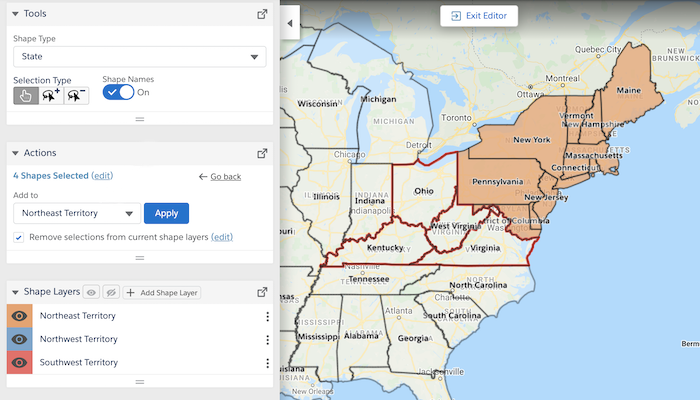
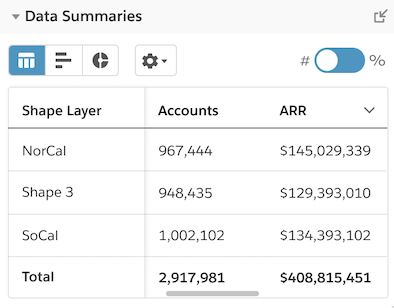
With our rollup metrics, you can see exactly what will happen to the number & size of open opportunities and potential revenue. Data summaries provide an at-a-glance view of how balanced territories are compared to one another before you even save any changes. Geopointe therefore solves the common problem of rolling out new territories only to find that one has far more potential than another.
[For a more in-depth look at data summaries in Shape Editor, take a look at one of our previous posts about the feature.]
Territory is more conceptual now that so many have moved to remote work and may not be travelling into their territories for sales calls. This makes it more difficult to keep track of and ensure balance across territories. Without a visual, it can be difficult to avoid any overlap or ownership disputes, thus a need for formal territory design and planning. Geopointe’s ability to visualize data helps ensure there is no crossing over into another rep’s business.
Sticking to one ‘single source of truth’ for ease and efficiency
Another challenge the article mentions is finding a simpler path to insights. There is a desire to reduce the number of systems a sales team relies on for information, and move toward a single data source.
This is understandable, especially when you consider how the more systems you are pulling your data from, the more likely you are to end up with inaccurate data. Whether it’s human error or systems duplicating one another’s data, not adopting the single source of truth philosophy can get messy fast. It’s safer and more efficient to gather your critical insights in one place. That place should be your CRM.
How Geopointe solves this problem: This one is pretty simple – Geopointe lives within the Salesforce platform, so customers don’t have to go to an outside source for information. Customers have told us that of the systems their sales team uses, CRM stands out as the most valuable. When your Salesforce CRM is combined with the insights of Geopointe, that value increases exponentially.
Pivoting in the right direction with data-backed decisions
We’ve heard from our customers that they’ve become much more data-driven and analytics-based with their planning and strategy. They recognized the need for solid strategies and intentional, focused targeting as the way they work changed after 2020.
It’s a good lesson to learn. Your time is valuable. You can’t waste that precious time executing on a hunch that doesn’t pan out. That post-pandemic agility needs to be put to use effectively. So how can you ensure that your sales team is shifting attention to the more profitable markets and areas?
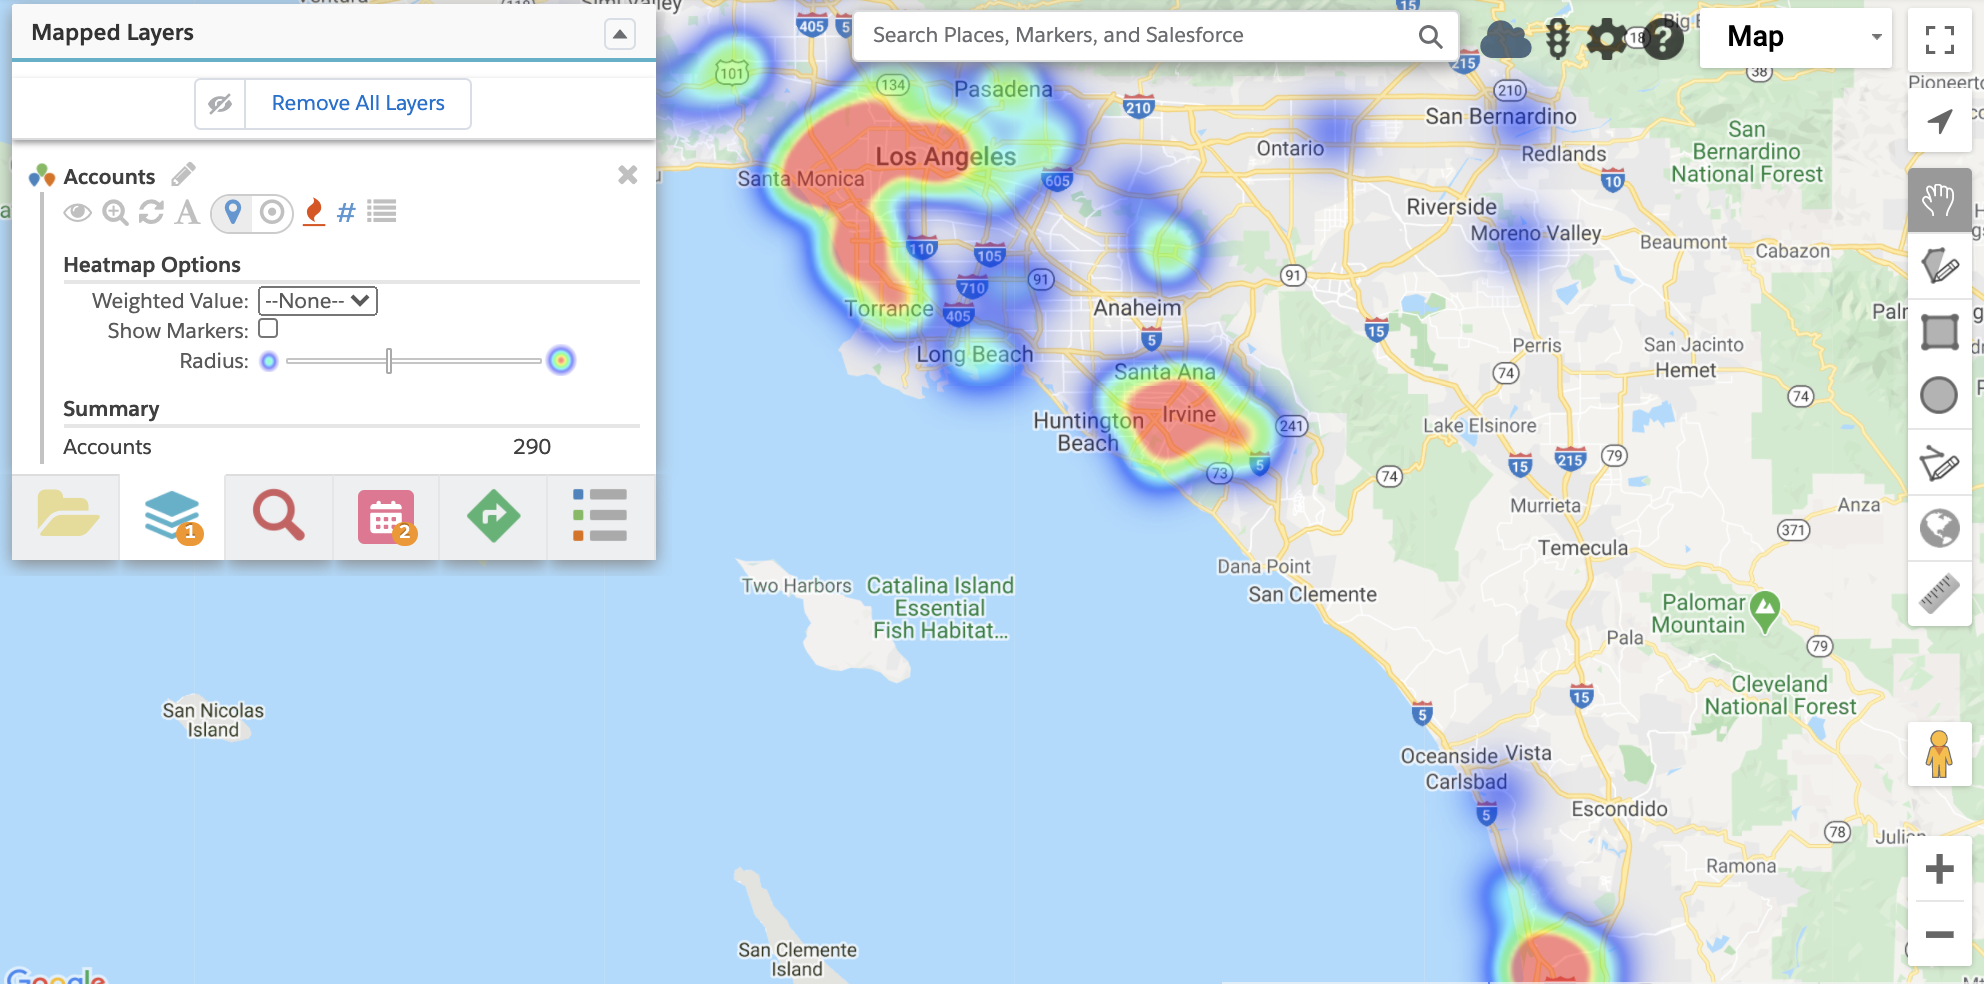
How Geopointe solves this challenge: Enter Geopointe’s Heat Mapping. What if we told you that in a matter of seconds, you could instantly understand which areas are most profitable and therefore worthy of devoting more time? It’s true – Geopointe can do that.
Psychology teaches us that most people’s brains are much more visual, and can process visuals 60,000 times faster than text. Consider the implications of having a visual representation of your data rather than relying only on text-based spreadsheets and reports. Solutions like Geopointe visualize data in many different ways, including heat mapping. This is where the instant understanding happens.
Heat maps are an efficient way of representing values with color coding (i.e. red = hot, blue = cold) to provide insights about trends in your data. For example, you can use Geopointe’s Heat Maps to pinpoint areas where you’re winning the most opportunities, or where the majority of your existing customers can be found. From insights like these that show opportunity size, annual revenue, and more, you can quickly determine areas of high growth potential.
When you look at an Excel report, it could take you hours to analyze and digest the information, but with data visualization like heat mapping, you see things instantly. Therefore, the challenges presented in the LinkedIn article, about how there isn’t time for “exhaustive analysis” and that leaders “need data-informed answers ASAP,” can be easily overcome with a solution like Geopointe.
Position your team for success in 2021 with Geopointe
Many organizations (including our own customers) are using the lessons learned from 2020 to create a better informed strategy for their approach to sales in 2021. Throwing things at the wall and hoping they stick is no longer effective, and most don’t have the opportunity to place a lot of different bets – it’s imperative that decisions are backed by data and analytics.
No matter which part of the process is most important to you – planning, executing, or analyzing – a solution like Geopointe can help.