
Geoanalytics in Layman’s Terms
Geoanalytics, like any other space, has its own jargon that can be tough to understand if you aren’t familiar. From the term itself, geoanalytics, to thematic maps, KML layers and shapes it can all get a bit overwhelming.
That’s why we’ve put together a list of the top terms you should know as you dive further into geoanalytics for business.
These are just a few of the terms we think are important to know as your organization begins to evaluate, implement or expand its use of geoanalytics technology.
1. Data Visualization
We have to start with what data visualization means, first, in order to understand geoanalytics and all the other terms associated with it. This is because geoanalytics is really a form of data visualization.
Data visualization is the representation of some type of information (or data) in the form of a visual element, such as a chart, picture, or a map. It’s a faster and clearer alternative to the traditional practice of working in spreadsheets with millions of data points.
2. Geoanalytics
Geoanalytics brings together geography and traditional analytics to provide location-based metrics for your data. It’s a way of using location to contextualize the records in your CRM through location-based data analysis.
This is where the connection to data visualization comes in. With geoanalytics, you can visualize trends geographically, such as identifying cities or counties of financial growth, concentrations of accounts by revenue and products sold by location. Typically, companies use technology geoanalytics
3. Geolocation
Geolocation is very similar to geoanalytics, and many people talk interchangeably about the two. In addition to geolocation, other terms that are commonly used to describe geoanalytics are location intelligence, geoanalysis, and geospatial analysis. All amount to the same idea: applying geography to your business processes to uncover analytical insights.
4. Data Sets
Data Sets are the building blocks of any geoanalytics solution. In this context, they are collections of CRM records that you can customize with filters and load onto the map. Think of them like a CRM report or a list that you’re segmenting into multiple categories and projecting onto a map.
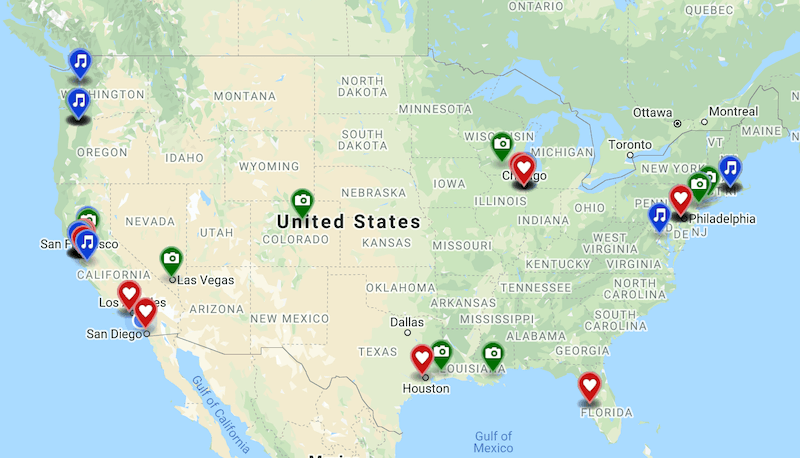
5. Map Markers
When projected onto the map, data sets contain map markers – these are really just small images that represent a record or place on the map. In most cases, markers can be customized by color, icon, or changed to a custom graphic.
By setting meaningful marker colors and symbols for your data sets, you can get immediate insights about your mapped data. That’s the understanding that makes data visualization so powerful.
6. Map Layers
When you project a data set onto the map, you have a map layer. A map layer is any set of data or information you can overlay on top of a map.
Usually, geoanalytics solutions allow you to add multiple layers of data at once. Solutions that allow you to toggle your layers of data on and off will also give you the ability to visualize your data in different perspectives.
This allows for more complex analysis of CRM data. For example, you may want to view accounts by industry with an added map layer containing leads by industry. That’s quick and easy with map layers.
7. Heat Maps
Heat mapping is a form of data visualization that represents values with color coding so you can make insightful decisions at a glance. This map type is a visual representation of your CRM data in concentrations instead of individual points or pins on a map.
You can view heat mapped data based on record count or by any numeric fields such as opportunity size, annual revenue, employee count or asset size. Areas of high concentration will appear red or “hot” while areas of low concentration will appear “cold” or blue.
8. Demographics (Layers)
Demographics refers to the study of a population based on social and economic factors, such as education level, income level, race, etc. With geoanalytics, you can use data sets composed of demographic information as map layers to gain a better understanding of the contacts or businesses you target.
Adding demographic data to a map can give businesses insightful data to make more informed decisions. Companies can use demographic data to better understand market potential, target the right audience, and evaluate ideal locations for offices, distribution centers, and franchise locations.
9. Thematic Maps or Layers
A thematic map, or thematic layer, allows you to roll up metrics (e.g. record count, $ amounts, % values, other numeric fields) grouped and colored by geographic boundaries. For example, color-coding a country by revenue would be a thematic map layer.
Though similar to heat maps, thematic layers allow you to see concentrations clearly delineated by geographic boundaries, rather than simply by hot spots. They aggregate metrics based on data sets, displaying them on a color range scale by geographic boundaries.
10. KML (Keyhole Markup Language) Layers
A KML file is a type of file that contains external geospatial data like places of interest, images, etc. and can offer insight about anything from crime statistics to recent earthquakes. KML layers can be viewed on top of your data in the Geopointe map for deeper understanding.
Some publicly-sourced KMLs offer rich information that can enhance your geographical analysis. As an example, you can take a KML file that outlines areas of drought from the U.S. Department of Agriculture and map your records against areas of heavy or low drought.
11. CSV Layers
CSV Layers are useful for temporary mapping of data if you don’t want to upload your data sets to your CRM just yet. You can import a CSV file (any file with a location) and display it on the map as a sort of preview.
Once you create a CSV layer, you can share it with others, set up point actions, and apply heat mapping and other visualizations. This feature isn’t available in all geoanalytics solutions, but Geopointe does offer this flexibility.
12. GeoShape or Shapes
A shape generated on a map based on a predefined data set such as countries, postal codes, counties or cities. Many sales managers use shapes to manage and assign sales territories to their team.
A geoshape can also be a shape based on boundaries the user defines by drawing directly on the map. You can build territories from a library of sub-shapes, including states, zip codes, metro areas and more.
For example, with shapes you have the ability to do the following:
- Create sales or support territories and assign records and ownership using Assignment Plans
- Define a search area to target outreach or analysis
- Use actions to communicate a message or apply a process to records in a certain area
- Define utility lines, waterways, and other landmarks
- Define a delivery or service areas around service centers and restaurants
13. Shape Editor
The shape editor is a powerful visual editor to create shapes from predefined boundaries such as states, zip codes, etc. It allows you to easily create new shapes or select and reconfigure boundaries with a few clicks.
To create a shape, the user chooses a shape type to overlay on the map, then visually selects the sub-shapes to include in a larger shape layer. This visual method allows for clean and contiguous territory creation and geographic insight.
Users get an at-a-glance perspective on relative size and relationship of territories, nearby landmarks, and whether shapes fall into certain zones. This approach saves time and improves the accuracy of shapes for use in territory management and other applications.
14. Calendar-Based Scheduling
Although it’s important to be able to adjust shapes and territories, that isn’t very useful unless you or your team are going out to visit prospects and customers and building those relationships. You need a scheduling solution that helps you plan your travel for these visits and even ensure you’re using the optimal route.
The calendar-based scheduling feature is fairly self explanatory: it lets you visualize scheduled travel plans and update events or appointments right from the map. However simple it sounds, though, it’s a mistake to underestimate this incredibly powerful feature of some geoanalytics solutions.
Depending on your job role, you can use calendar-based scheduling to organize your own calendar or multiple calendars for your whole team – all in one place. Other capabilities include:
- Use location insight to plan appointments for yourself or an entire team
- Set default working hours and get alerts when appointments conflict
- Fill schedule gaps with new appointments from the map
- Get a geographic perspective of your calendar by day, week, or month
- Instantly schedule multiple appointments with one click
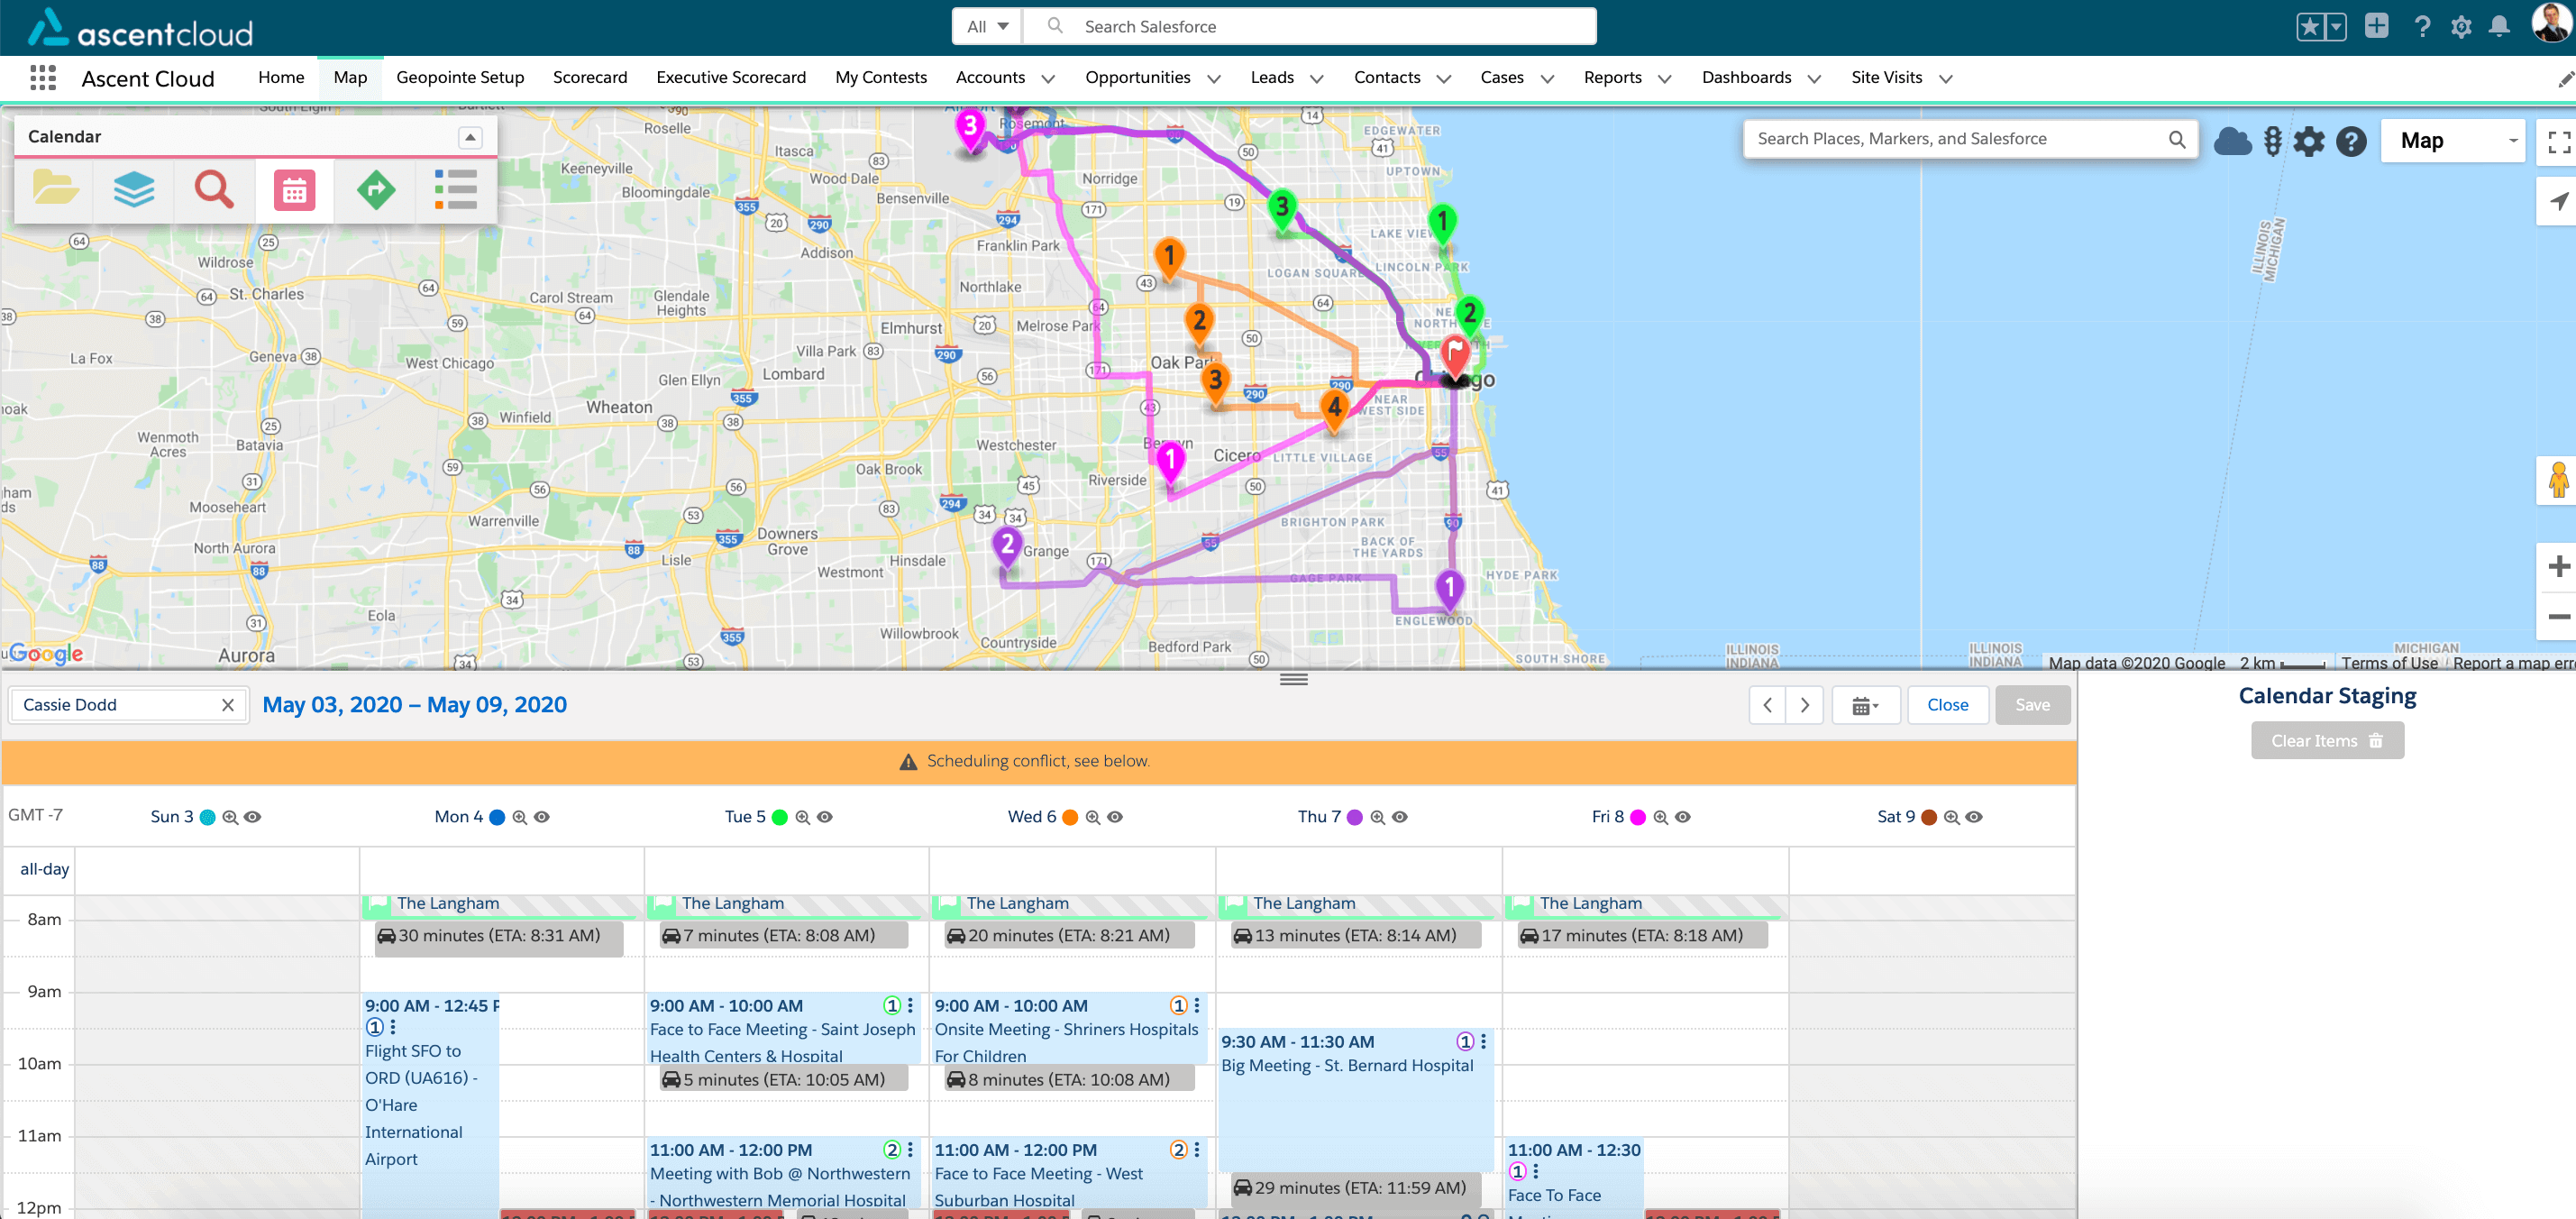
15. Route Optimization
Once you have your schedule planned out and visits or appointments confirmed, you’ll need to figure out the best route to take to get from place to place. This is where route optimization can provide value, giving you back time in your day to maybe squeeze in an extra visit.
Optimizing a route re-organizes the order of the stops to the most optimal manner.
Your route is the path generated between two or more destinations, but without a tool for route optimization you may be wasting precious time in your day that you could have used for an extra visit. The best geoanalytics solutions help ensure you’re directed along the most efficient route no matter what your schedule is.
16. Check-In / Check-Out
With some geoanalytics solutions that include routing and calendar-based scheduling, you can check-in and check-out from each appointment or stop. Mobile users can check-in and -out of their stops while in the field, confirming their location and logging information about their visit.
This is tracked in your CRM and associated with the corresponding record, allowing teams and management to verify field activity and trigger workflows. It allows for faster and more accurate data collection in-the-moment.
Applying What You’ve Learned
Maps and spatial data can instantly help users uncover new insights from their CRM data. Geoanalytics does this by providing new context and perspective to data that is simply not possible with reports and spreadsheets.
The ability to visualize data and understand its relation to any other given location in the world is incredibly useful and compelling. Now that you’re an expert in the language of geoanalytics, why not continue learning about some specific use cases for it?
Discover the Top 10 Use Cases for Geoanalytics Software.
")

