Geopointe streamlines business processes with the help of powerful features that visualize your data. One core feature – the visual shape library – makes this process infinitely easier for end users, providing custom shapes that can be used directly from the map. But, before you can take advantage of its full power, you first need to know how to use it.
If you’re new to Geopointe or unsure how to use the visual shape library, here’s a quick guide to help you put this dynamic feature to use:
Select an Ideal Shape Type
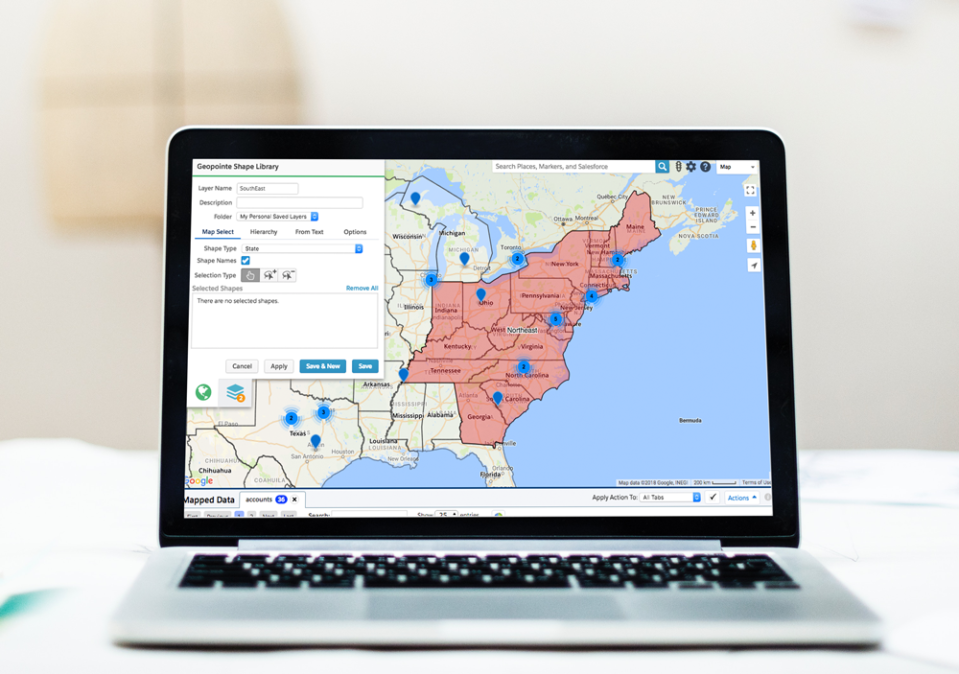
First, open the visual shape library by clicking the globe icon in the menu on the right side of the Geopointe map. Then, select one of the 14 available geographic shape types (e.g., ZIP code or state) from the “Shape Type” drop-down menu. For simplicity, shape types are limited to the area of the map you’re zoomed in on. If you’re looking for something that isn’t on the list, try moving the map around to the area where the shape should be or zooming out. For example, states show up when you scroll over the United States, but provinces show up when you scroll over Canada.
Work with Multiple Shapes
To handle multiple shapes at once, use the lasso tool to draw around shapes to add or remove any that touch or fall within the drawn area. Next to “Selection Type” pick the middle option to add shapes with the lasso tool or pick the right option to subtract shapes. The lasso you draw doesn’t have to be perfect, as Geopointe automatically determines what falls inside the shape for you. If the map is over the United States and “State” shape type option is selected, a circle can be drawn around the northeast to select all states within the northeast, as an example.
Color-Code & Label Your Shapes
 Geopointe’s visual shape library also allows you to make additional aesthetic adjustments to your shapes within the “Options” tab on the right side of the window. Within here you can adjust the color and opacity of each shape by moving the corresponding sliders. Once you have all your shapes sized and colored to your liking, you can go in and give them custom labels that show up directly on the map. Once you customize enough shapes, you’ll continue to identify better ways to label, color and organize your shapes for your specific business needs.
Put Your Shapes to Work
 Now that you’ve created and customized your shapes, it’s time to put them to work. By default, other map layers are hidden when entering the visual shape library, but this can be addressed by toggling the “Show Layer” icon next to the layer name. This helps you build new shapes on the fly. As you continue to get more familiar with the feature, you’ll continue to discover more and more use cases that help streamline your entire business process.
Are you new to Geopointe? Check out our webinars library for helpful tips and tricks that streamline your mapping experience!