Geopointe’s visual capabilities make your Salesforce data shine, either on its own or when paired with other data. To help give you ideas for how your company may use Geopointe, here are a few possible maps you can create with our basic functionality.
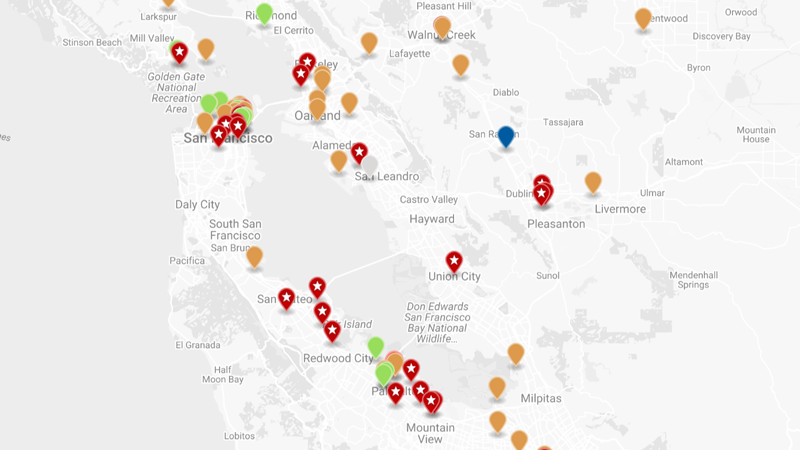
Color your data in a way that will be useful to you at a quick glance. Color markers allow you to customize each marker based on a field value inside of Salesforce.
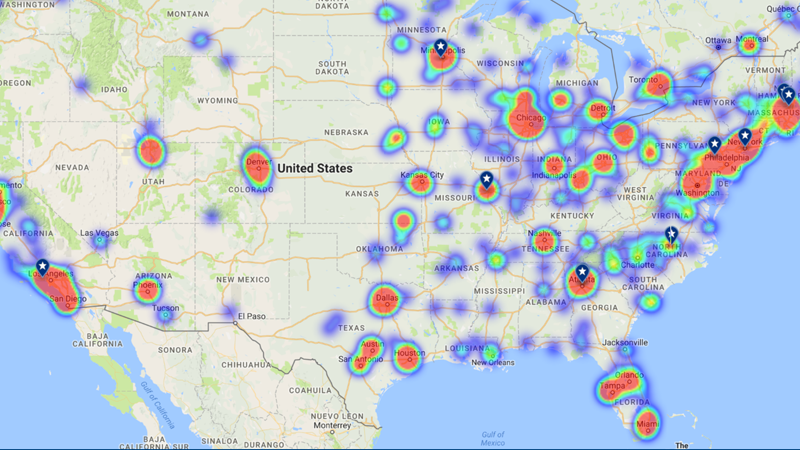
Get the bigger picture with heat mapping. This particular map is Opportunities, heat-mapped by amount. For further clarity, our top ten deals are overlaid on top, easily seeing which cities had the highest deals (but maybe not the highest total opportunity wins).
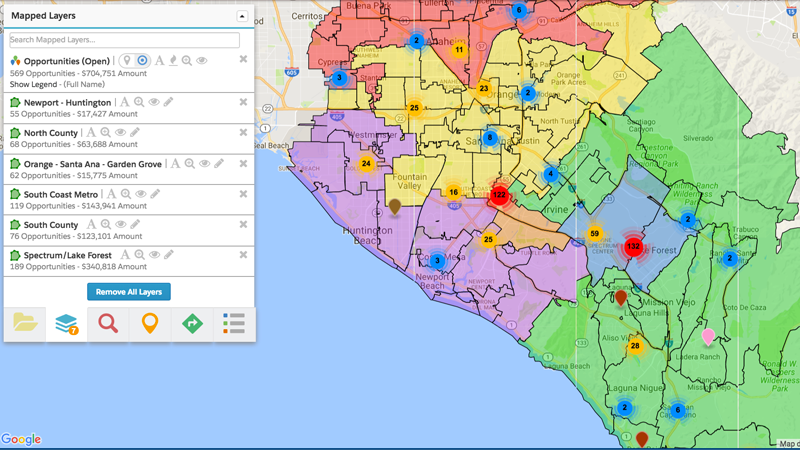
Clusters allow you to see concentrations of your data in a more precise way than a heat map. Use it to help you define and build out territories using our shape library.
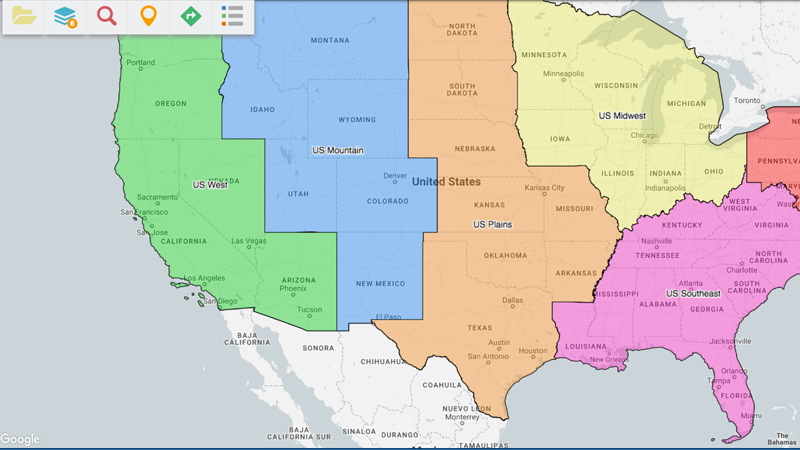
See your territories easily using our shape library’s merged shapes. The merging allows you to see the shapes without the individual shapes inside the larger shapes, as well as labels for the whole territory.
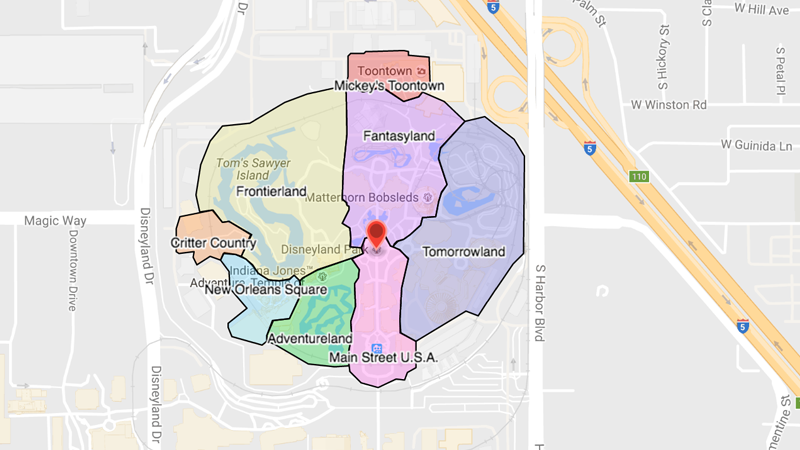
If you need to create territories or shapes that don’t follow specific geographic boundaries, we have custom polygon shape building at your fingertips, too. These shapes can be used to define delivery areas, set franchising boundaries, draw custom territories, or represent any kind of oddly shaped area on the map.
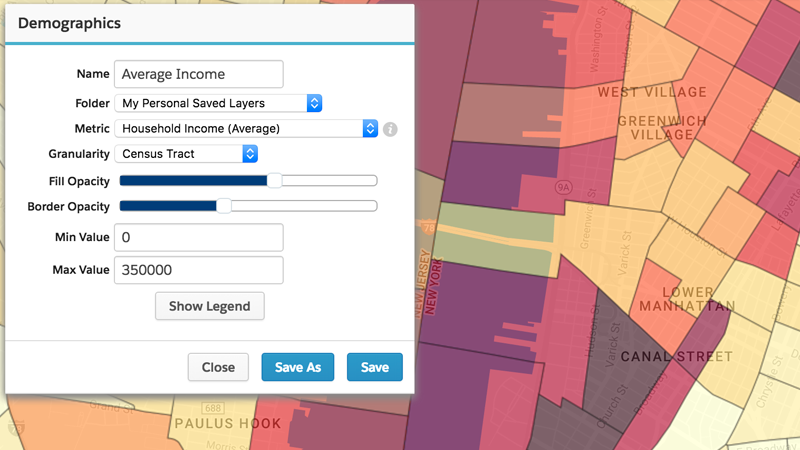
Demographics allow you to compare your data against US census information. Find new areas to target or identify risky investments based on income, age, or other available demographic information.
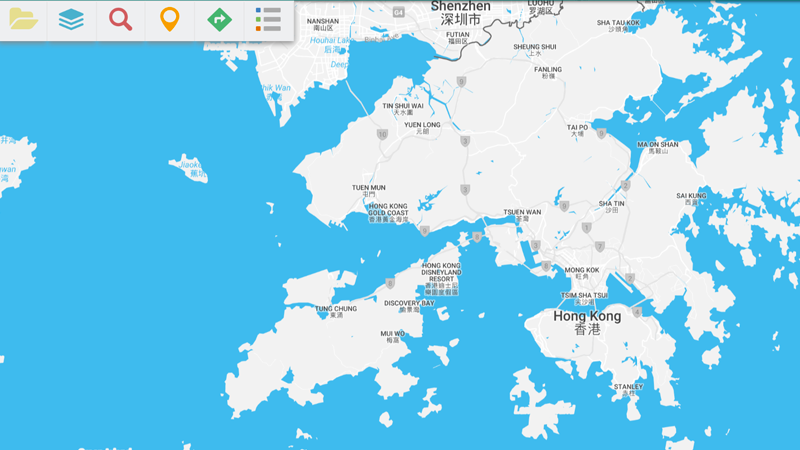
Map Styles allow you to fully customize the map. Whether using color schemes you create yourself or schemes from outside sources, you can personalize the map to meet your aesthetic needs.
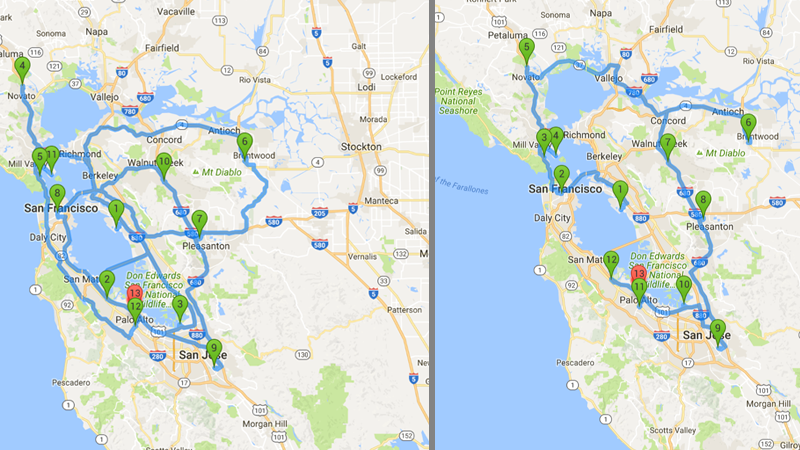
Routing is a fundamental feature in Geopointe, and sometimes nothing is better than seeing chaos become order. Optimized routing allows you to choose your starting and ending location and find the best route to get to every stop.
Geopointe is a visual experience, bringing your Salesforce data to life in ways a dashboard or report cannot. Hopefully this post helps you see a new way to use the Geopointe map. Just imagine what cool maps you could create to see your data in a new way!
If you are not using Geopointe, you can start today with a free 15-day trial. Simply install Geopointe from AppExchange.