 Map outlines are cool. People make art out of them, and sometimes even put it on their body. Monday’s USMNT win against Ghana in the FIFA World Cup brought John Brooks Jr. to the spotlight. A German-born American defender who scored the winning goal in the 86th minute. He also has some really cool tattoos that represent his heritage. One is a map of Germany, the other a map of Illinois. We were super excited about yesterday’s game, and when we learned about Mr. Brooks’ tattoos, it reminded us of all the cool things you can do with map outlines in Salesforce using Geopointe, and of course, we wanted to share.
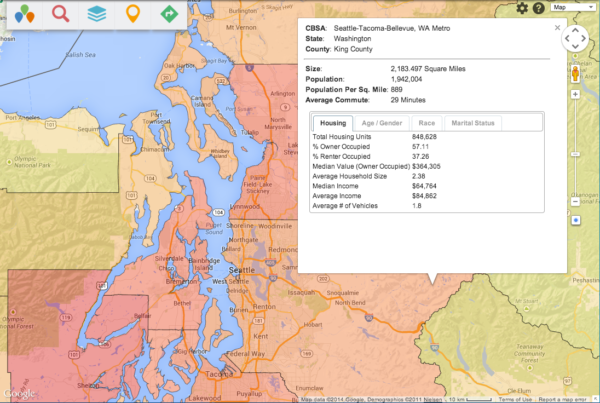
Demographic Overlays
A lesser known feature of Geopointe is Demographic Overlays. Apply US Census data to your maps and view metrics like household income, age, race, or marital status distributions inline with your Salesforce data. You can choose to show map outlines at the State, County, Tract or Block Group levels.
Shape Search
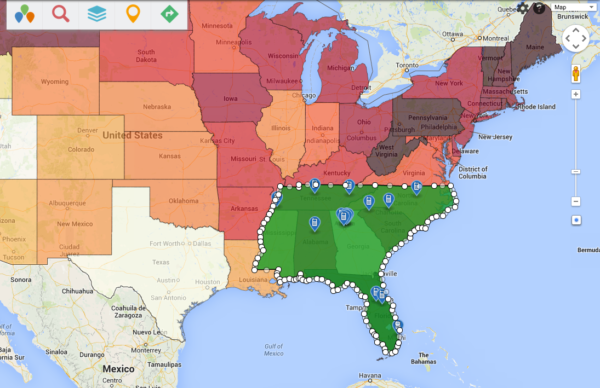
Demographic Overlays serve their purpose….but what if you want to use that state or county outline as a filter on your map? Shape Search lets you do just that. You can create any shape you like, but why not use Demographic Overlays to trace the outline of several states together to make a sales territory? Something like this:
This isn’t limited to just the US, though. You could zoom in and use the drawing tool to trace around some other map border that is not included in the US Demographics Overlays. Here is one I did of Brazil:
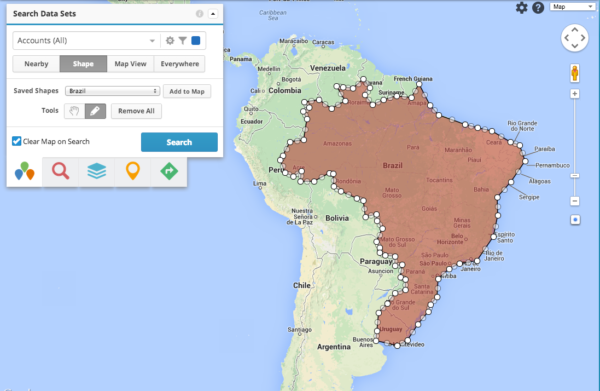
By drawing and saving these shapes, you are creating your own powerful, custom overlays. Use these borders to filter and take actions against your data like Add to Campaign or Change Owner. After drawing these shapes, make sure you save them, so you can re-use them on your map whenever you need to. Just pretend you are a tattoo artist…that will make drawing your sales territories a lot more fun.
Thematic Mapping in Geopointe Analytics
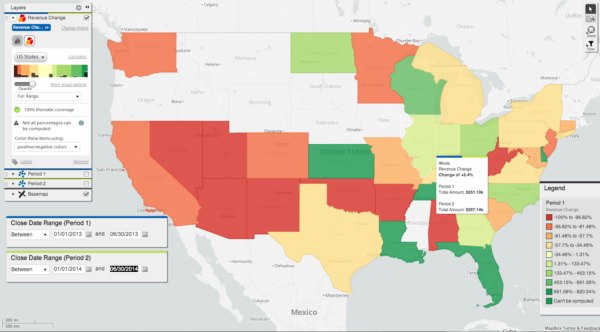
For the hardcore cartographers reading this, these are all technically examples of Thematic Mapping. Specifically, Choropleth Mapping, or “showing statistical data aggregated over predefined regions, such as counties or states, by coloring or shading these regions.” Thematic Mapping in Geopointe Analytics gives you the power to create maps that can display trending data by region, and answer questions like ‘How did we do in Texas this month vs. last month?’ or ‘which areas are expanding or contracting?’
So maybe you are not ready to go out and tattoo the outline of your state or country on your body…but you can grab a quick win at your company by installing Geopointe from the Salesforce.com AppExchange and using the power of map outlines with your Salesforce data to become a star and reach your goals! (<– see what I did there)
Have you tried these Geopointe features yet? What other kinds of things would you like to do with map outlines in Geopointe? Let us know on our ideas site.


