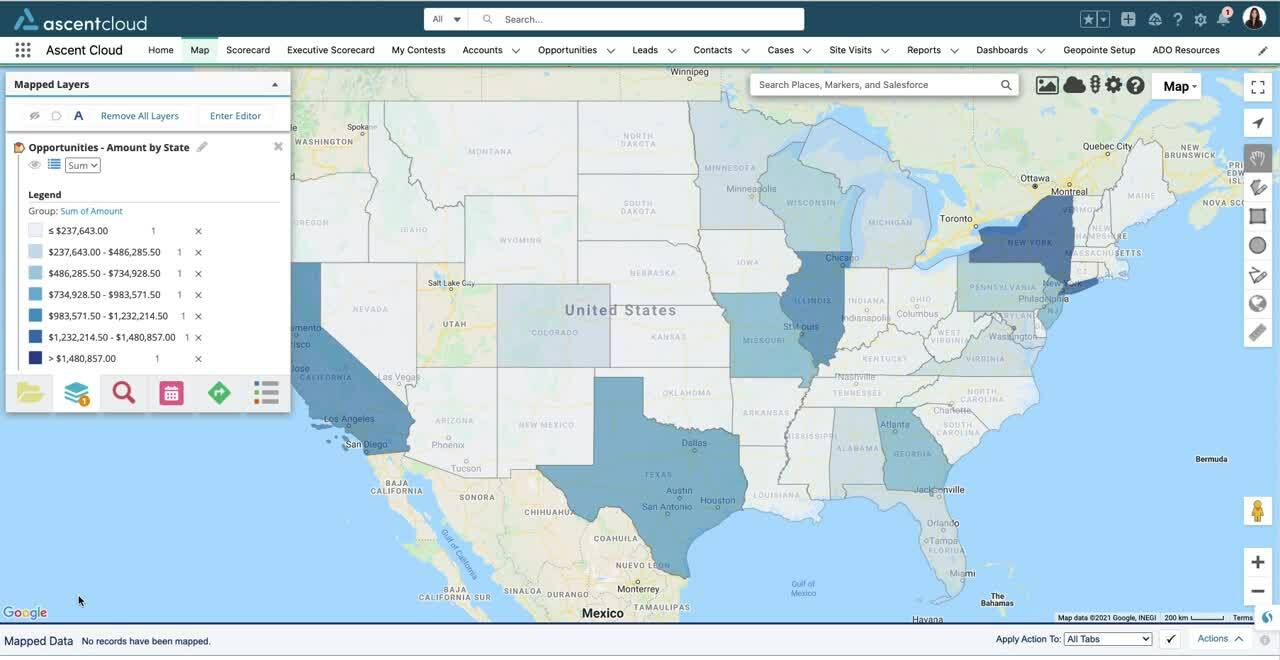
Thematic Maps help you see the big picture. They allow you to rollup a metric for any given data set and group those results by geographic boundaries you define. For example, rollup metrics such as record count, $ amounts, % values, or anything numeric for data sets such as won opportunities closed this quarter or customers by revenue, and view your results on the map using geographic boundaries you define.
Thematic Layers are similar to Salesforce’s Wave Analytics feature, but with Geopointe it’s much more flexible, doesn’t require a developer, is only a few clicks away and is part of the core license.
Organizations can create unlimited Thematic Layers. Layers offer calculations of Sum, Average, Minimum and Maximum for each metric and those measurements can be changed at runtime. A set of geometries can be applied to the layer (e.g. US States + Canadian Provinces + Mexican States).
Unlike Heat Maps, the metric is clearly delineated by geographic boundaries. Heat Maps show hot spots where the metric is concentrated, the lines are blurred on where the hot spot starts and stops. Thematic Maps allow you to see similar concentrations, but modify your point of view based on boundaries.
To learn more about Thematic Layers, visit our help site.
Click below for a quick look at Thematic Mapping in action.